

A Few Definitions
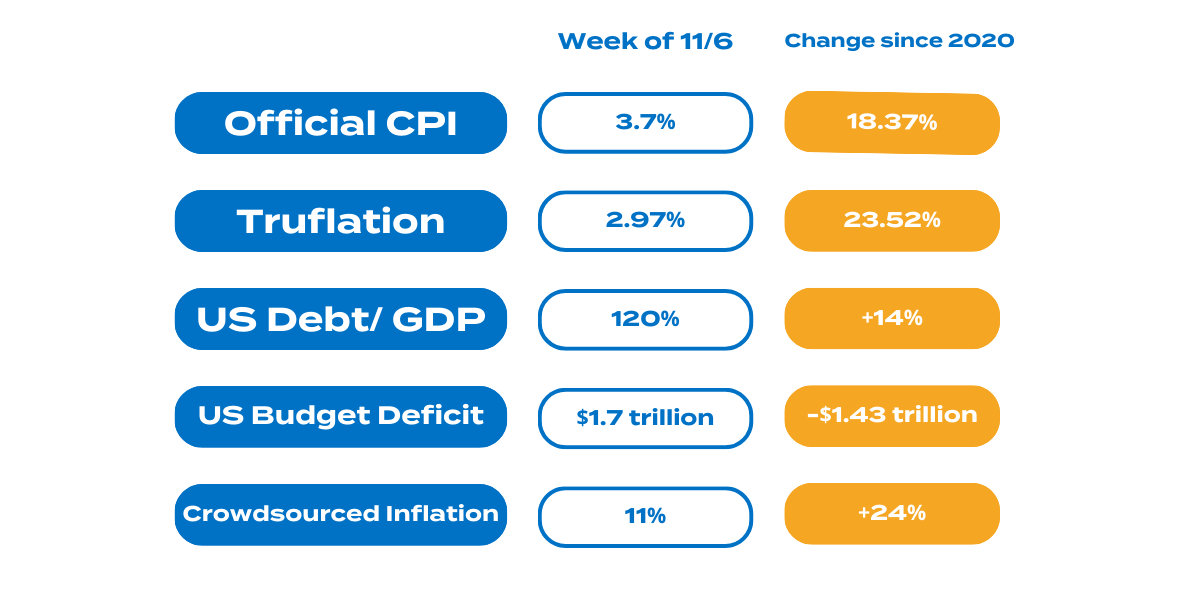
1) Official CPI- The CPI stands for Consumer Price Index, which measures the average change over time in prices paid by consumers for a basket of goods and services. It's a key indicator of inflation, showing how much more expensive these items become over a period. Understanding the CPI is important because it affects purchasing power and can influence economic policy decisions. This is measured and reported by the Bureau of Labor Statistics (BLS).
2) Truflation- Truflation is a private company that uses a slightly different methodology to come up with year on year (YoY) inflation figures. Combining this with the official CPI is helpful to see a more balanced view of consumer prices. As you can see in the chart above, sometimes it is lower than official CPI on a week to week basis, but the aggregate is reporting higher inflation since 2020.
3) Debt/GDP- The debt-to-GDP ratio compares a country's total debt to its economic output, measured by Gross Domestic Product (GDP). A high ratio means a country has high debt compared to its economic size, which can be a concern for its economic health. A lower ratio is generally seen as healthier, indicating the country's economy is strong enough to manage its debt.
4) Interest Expense as % of GDP- The Interest Expense as % of GDP measures how much of a country's economic output is spent on paying interest on its debt. A high percentage indicates a significant portion of the country's economic resources goes towards servicing debt, which can limit spending on other important areas like infrastructure or education. This metric is important as it helps assess a country's financial burden and its capacity to manage and repay its debts.
5) Crowdsourced Inflation- Crowdsourced Inflation refers to gathering information on inflation from the general public's experiences, recognizing that official sources like the Consumer Price Index (CPI) or private sector measures like Truflation may not fully reflect the varying costs individuals face in their daily lives. Since people buy different items based on their unique preferences, they experience inflation differently. Although this method is not scientifically rigorous, it aims to gather a broad range of personal insights and approximate figures. When combined with official data, it helps provide a more comprehensive view of the inflation landscape. Please fill out the survey at the end of this email to submit your inflation data.
The United States' Fiscal Position
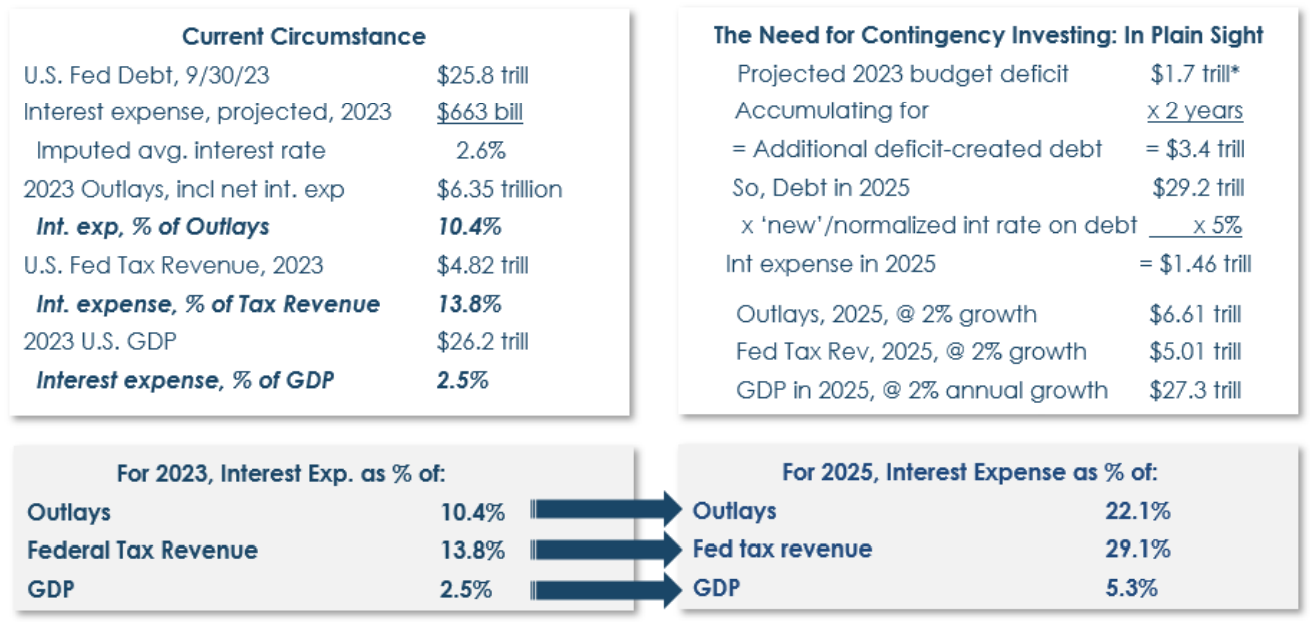
This week, I read Horizon Kinetics quarterly report and it gave some incredible figures for how high interest rates affects the U.S. fiscal position. Running deficits as the nation with the world reserve currency is a privilege, and it may not seem like it matters in the short term, because most haven't experienced a currency crisis in their lifetimes, let alone living in the country that is the world leader. The chart below shows how much debt we currently carry as a country and the outlays needed to support Social Security, Medicare, and our other obligations.
Most of the country's debt is financed at older interest rates of 2.5%. Once most of this debt matures in 2025, it will need to be refinanced at current rates, greatly increasing the debt burden. This paints a very simple scenario, if rates stay high, nearly 30% of tax revenue will be used to service interest on our national debt, and exorbitant money printing will be needed to service that debt- hence more inflation. If the Fed cuts rates to where they were at 2.5%, inflation likely catches a bid and increases in another wave much like the inflationary waves of the 1970's. Either way, inflation is here to stay, and the erosion of purchasing power is inevitable.
At a sovereign level, this chart from Peter Bernholz' book "Monetary Regimes and Inflation," it shows the increase in the cost of living starting in the early 20th century and expanding rapidly post 1971 after getting completely off the gold standard.
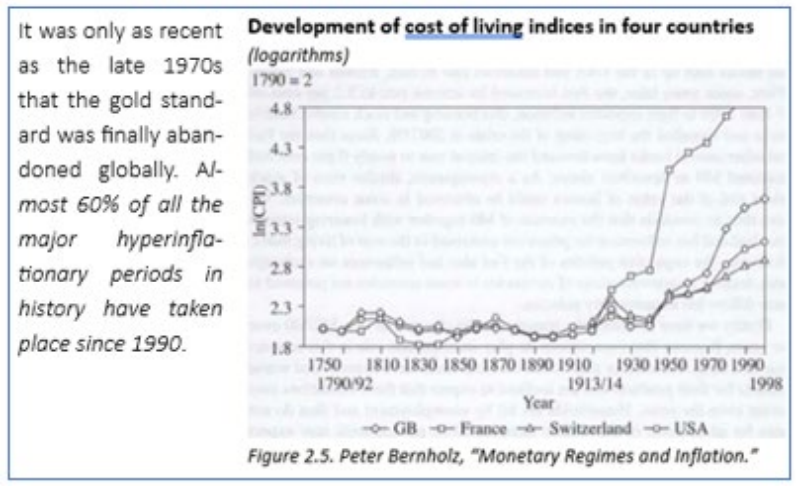
"60% of the all the major hyperinflations in recorded history have taken place since 1990. The attributed reason is that after the world abandoned the gold standard in the 1970s, a decade or two was sufficient time for central banks’ unconstrained paper money printing to result in excessive currency debasement." - Horizon Kinetics Q3 Commentary
Budget Deficits Matter
For those that say deficits don't matter, I challenge the premise. They don't matter until they do. As the country with the world reserve currency, they don't matter in the short term for the U.S., but matter in the long term. The expansion of debt and debt service due to an aging population, political gridlock and the willingness to spend indefinitely from both parties, running higher and higher deficits leads to bad outcomes. While hyperinflation like in Venezuela or Zimbabwe isn't imminent, this happens to all countries with high deficits. They take years and decades to play out, but can happen quickly if spending increasing quickly without having tax revenue to cover our outlays.
Well tax the rich right? Why don't we tax more? For 1) it's not a popular platform to run on politically, and 2) taxing the wealthiest a higher % is only a drop in the bucket for current outlays. The table from the Congressional Budget Office (CBO) below shows that we have a deficit of 33% of the total revenues we bring in via tax. Increasing taxes can discourage private sector output, lowering GDP, and thus be ineffective at covering our deficit, and decreasing overall revenue as people make less. The most rational thing to do is to spend less, but our commitments like Social Security, Medicare and other programs are not things we can walk back on.
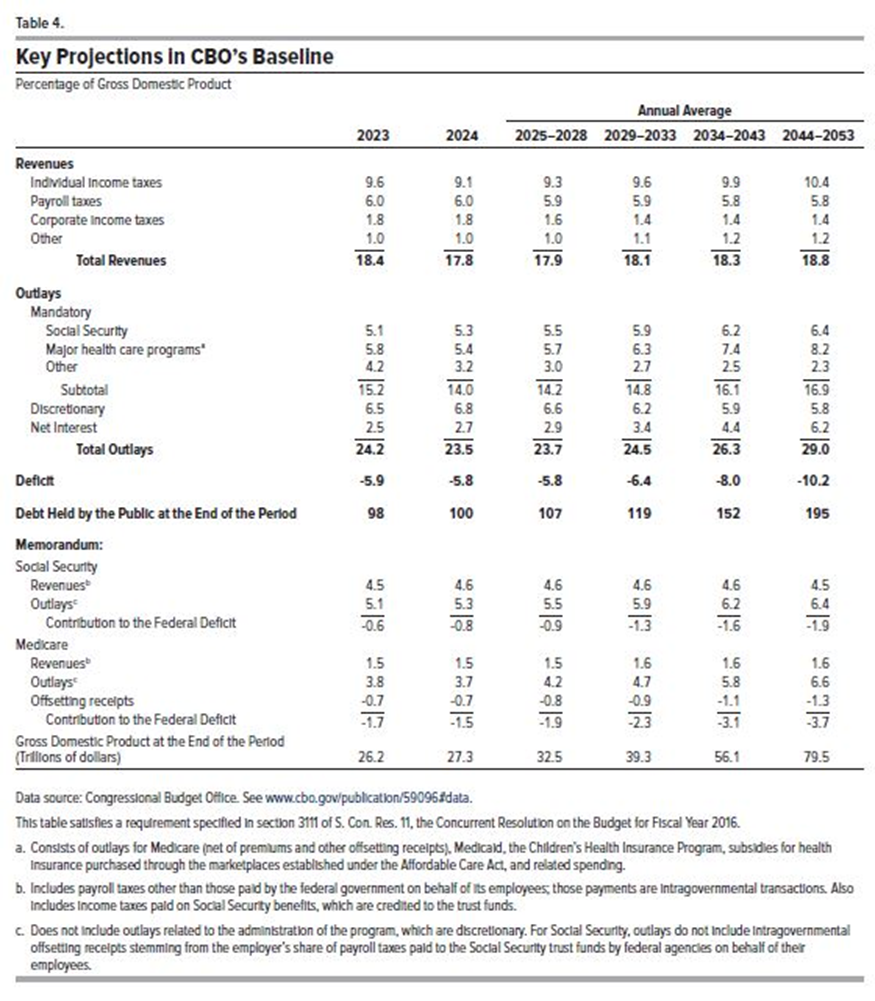
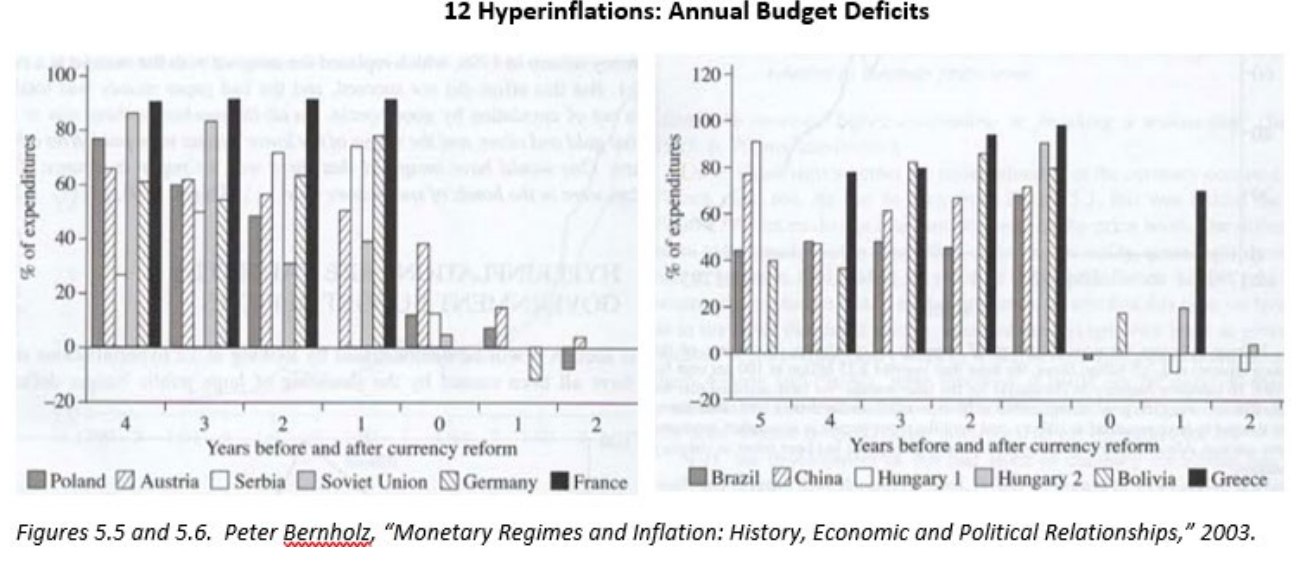
As the table shows above, by 2053 we're projected to have a deficit of over 35% of current expenditures. This is not considering any decrease in tax revenue due to economic slowdowns, or an increase in spending from current projections. Both things are likely to happen. Using that 35% figure (which most would agree is VERY conservative), we start to get into hyperinflation/currency crisis territory as seen in Professor Bernholz' research below.
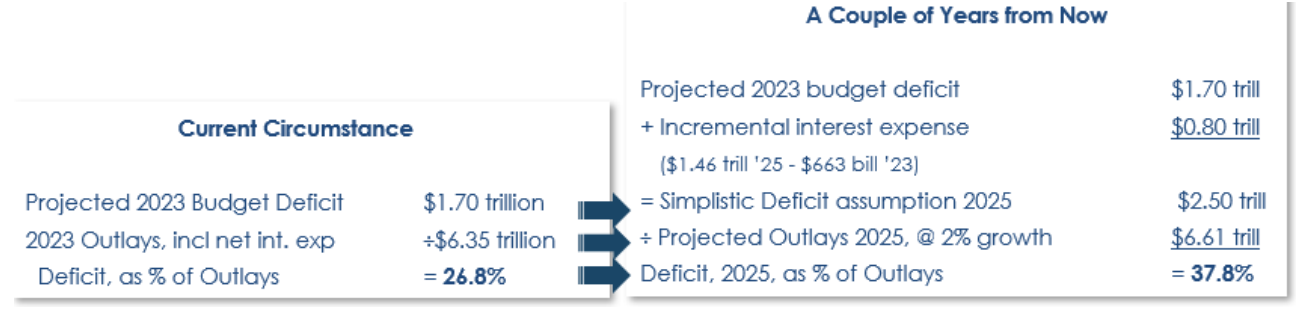
The Horizon Kinetics team has done a bit of math that gets us to a 37.8% deficit as a percentage of expenditures by 2025, using slightly different assumptions from the CBO:
The takeaway is that inflation is here to stay. We have entered a new paradigm where we cannot necessarily control inflation, expenditures, and debt service through the Fed like we used to. It is my goal to continue to piece this information together as a public service so everyone is up to date around the fiscal state of our country.
We Need Your Input: Share Your Personal Inflation
As you enjoy your Sunday, we have a small yet significant request. Could you spare just 2 minutes of your time to contribute to our unique inflation survey? Your input is invaluable in crafting a comprehensive and authentic narrative of how inflation impacts individuals from diverse walks of life.
Each person experiences inflation differently, influenced by their unique preferences and lifestyles. By sharing your experiences, you become a crucial part of a community-driven effort to understand inflation beyond the generic 'official' figures.
Your voice matters in painting a more realistic picture of the economic landscape. Let's collaborate to reveal the story of inflation that affects everyday people like us.