

⏱ Today's Read: 8 minutes
One of the biggest challenges facing modern economies is inflation. We've all heard it in the headlines, "inflation is running hot," or "inflation is transient," or "inflation is coming down." What does this all mean? Unfortunately, reported inflation numbers are often manipulated due to periodic adjustments and other factors such as changes in the composition of goods and services included in the inflation basket (a basket is just the typical costs of a household), which can make it difficult to accurately track the true rate of inflation over time.
In addition, some governments or central banks may have incentives to understate inflation in order to appear more successful in managing the economy, which can further obscure the true rate of inflation. This can have serious consequences for individuals and businesses alike, as it can lead to misallocation of resources, distorted economic decision-making, and ultimately undermine the stability of the economy as a whole.
This is largely apolitical and has been done for thousands of years, across parties, governments, and empires. Typically, inflation can be used as a 'hidden tax' on the population to finance spending that cannot be supported with tax receipts (mostly wars, but also 'war-time' spending like during COVID-19). If you want to dive deeper about how inflation contributed to the fall of the Roman empire, read here. This can provide context about how this isn't a new phenomenon.
At its core, inflation is caused by those that print money (i.e. the Federal Reserve) and is responsible for most of the accounted inflation as it is due to an increase in the money supply. Other economists will say that supply bottle necks, natural disasters, or other shocks also contribute. One easy example of a supply shock that contributes to inflation is a storm that hits a remote island that wipes out all the coconut trees. To find a coconut is tougher and would probably be more expensive.
Supply shocks, like the example above are real, but do not persist over long periods of time (think in decades here). The core part of inflation is due to the increasing money supply from the Federal Reserve. More on this in later posts.
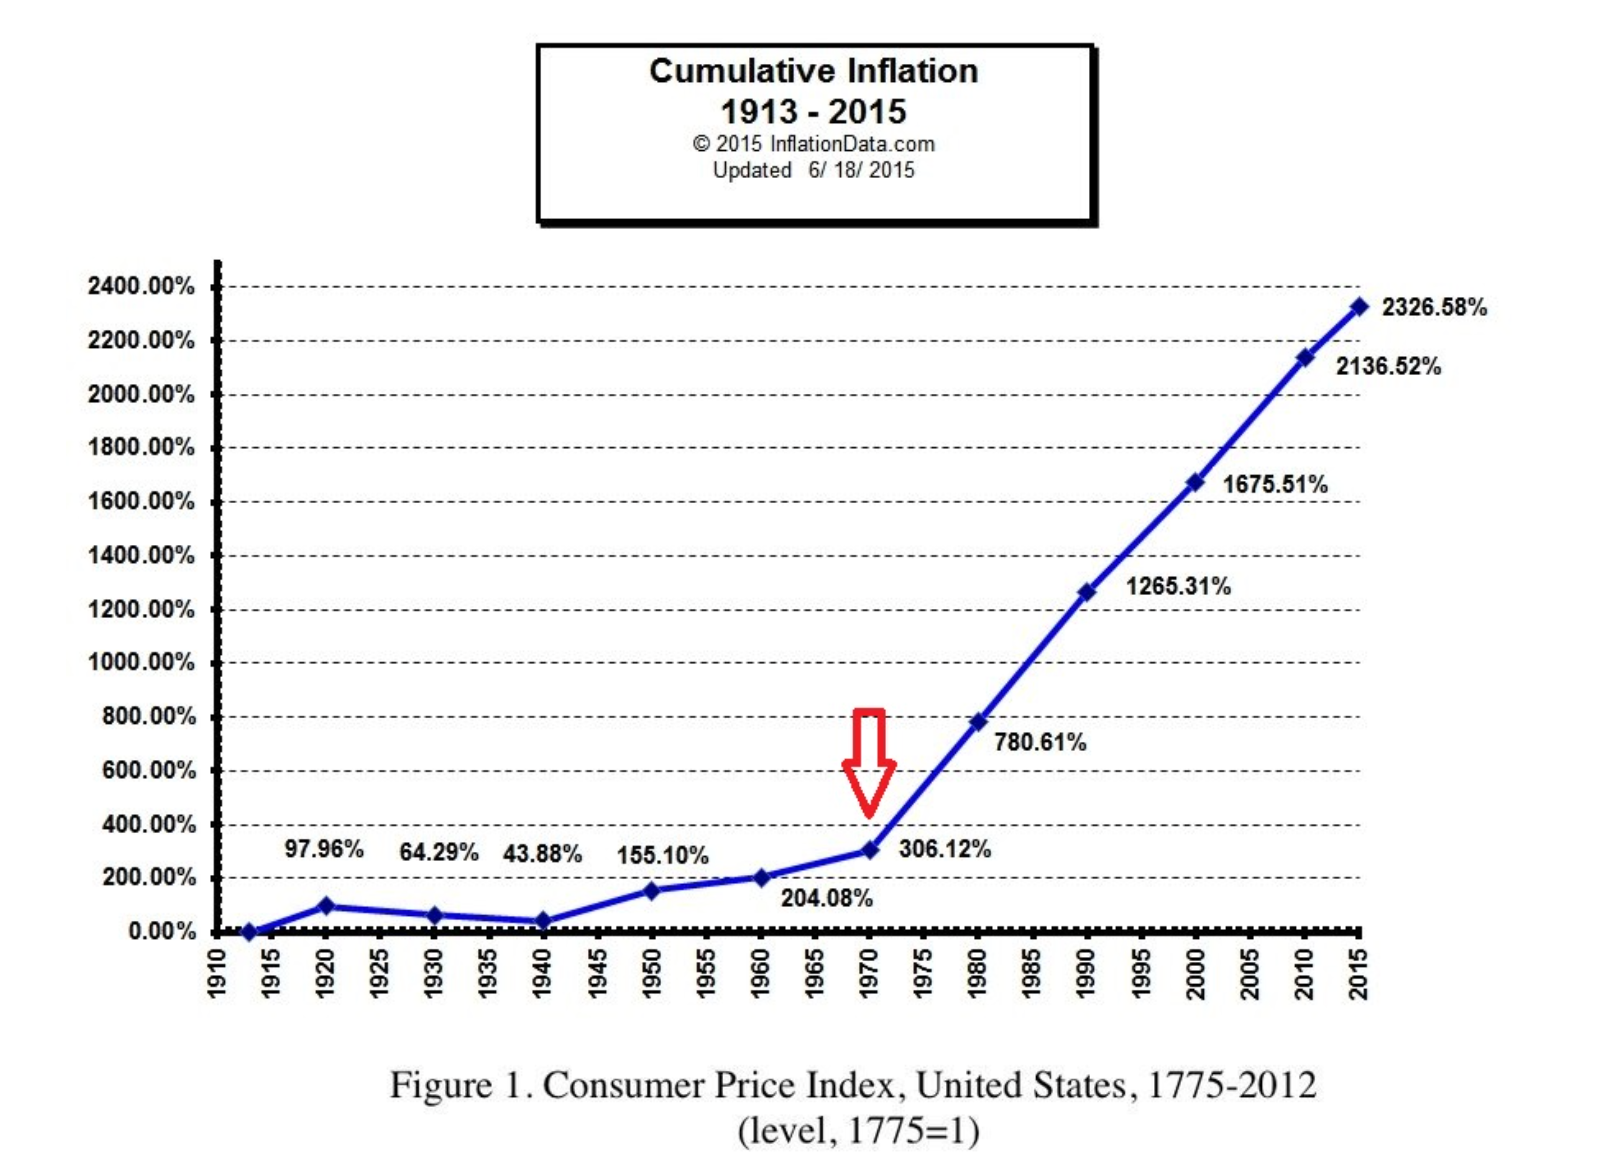
This graph illustrates the increase in inflation from 1971 onwards when the United States closed the gold window (meaning gold no longer backed the U.S. dollar), and was nearing the end of the Vietnam War. Before 1971, the money supply could be somewhat held in check due to the partial backing of gold and subsequently imposing some financial discipline on policymakers.
Now, since the U.S. and other nations have the ability to print currency at will, our national debt has skyrocketed and wealth inequality has increased. This increase in inequality is because those that hold assets have those assets grow at an inflated pace while those without assets have their day to day purchasing power eroded.
The increasing cost of goods and services typically hurts a lower income family, and causes them to feel like they can't save or maintain our purchasing power over time. The Bureau of Labor Statistics (BLS) has recently altered the methodology used to calculate the consumer price index (CPI, or day to day prices), which has further exacerbated the confusion of what true inflation really is.
The five reasons below outline how this number can be underestimated, misleading the public into thinking inflation isn't eating away at their hard-earned savings.
- Excluding certain items: The government's Consumer Price Index (CPI) excludes some items that are important to certain groups of people. For example, the CPI does not include house prices (as it's considered an investment if purchased, and not spending), which can be a significant expense for many people.
- Substitution bias: The CPI assumes that consumers will switch to cheaper alternatives when prices for certain goods and services increase. This can be a reasonable assumption in some cases, but it may not be accurate for certain goods or for all consumers.
- Hedonic adjustments: The CPI uses hedonic (in economics, hedonic refers to a method used to measure the value of a product or service based on its attributes and the satisfaction they provide to consumers.) adjustments to account for improvements in technology or changes in quality of goods and services. This can make it difficult to compare prices over time, as the reported inflation rate may be lower than what consumers are actually experiencing.
- Weighting: The CPI weights different goods and services based on their importance to the average consumer. We take issue with this as each individual values things slightly differently and allocates their paycheck to things that are important for them. Calculating this on the aggregate is impossible and the weightings may not accurately reflect the spending patterns of certain groups of people, such as the elderly or low-income individuals.
- Changing basket of goods: The CPI basket of goods and services is updated periodically to reflect changes in consumer spending patterns. However, this can make it difficult to compare inflation rates over long periods of time.
These adjustments are justified by saying a modern economy evolves and the CPI must keep up. But this misses the key piece of data we're trying to understand: the change in prices from one month to the next. If we substitute hamburger for steak because steak gets too expensive, then that expensive steak should be captured. Instead, it shows that beef's price didn't rise because of that substitution of hamburger.
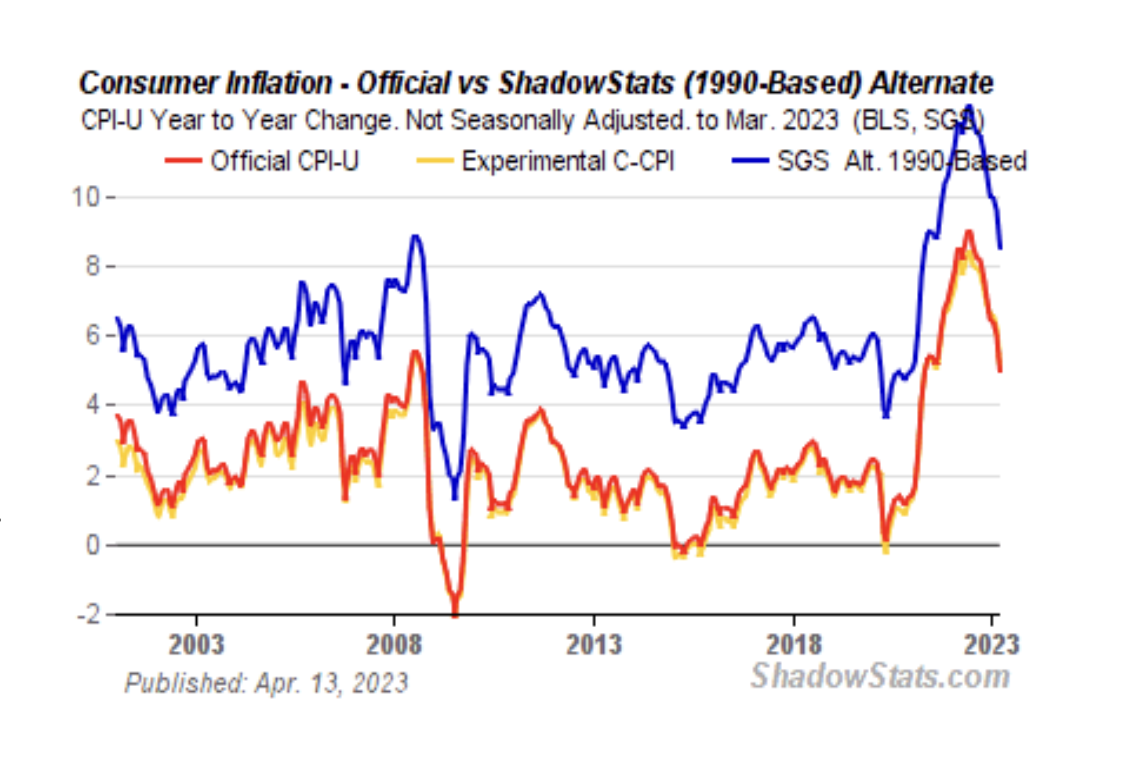
This chart is from John Williams' ShadowStats, an independent data source that tries to accurately measure inflation. As you can see, from 1990-2023, John's measured inflation is nearly double than what the government has reported. John's method has tried to keep a consistent track of prices of the same goods, instead of substituting goods like we talked about above. Inflation this high is troubling, and can help explain why things feel more expensive.
If you want to take a deeper dive, take a look at John's work to see how he calculates CPI and do the deep dive yourself. There is a lot of information out there and is best to verify the data from multiple sources.